Tutorial -
Famliy Genome Browser
DESCRIPTION
The Famliy Genome Browser (FGB) is developped to provide comprehensive analysis and visualization for family genomes. The FGB can visualize family genomes in both individual level and variant level effectively through integrating genome data with pedigree information. Family genome analysis, including determination of parental origin of the variants, detection of de novo mutations, identification of recombination events and identical-by-decent (IBD) segments, etc., can be performed flexibly. Diverse annotations for the family genome variants, such as dbSNP membership, linkage disequilibriums, genes, variant effects, potential phenotypes, etc., are illustrated as well. Moreover, the FGB can automatically search de novo mutations and compound heterozygous variants for a selected individual, and enable investigators navigate to high-risk genes with flexible navigation options. These features enable users to investigate and understand family genomes intuitively and systematically.
The FGB is best accessed using Google Chrome, and works smoothly as well with other web-browsers, including Mozilla Firefox, Safari, Microsoft Internet Explorer (Version 10 or later), Opera, etc. SVG is used as the graphic engine to plot the visual elements, thus some earlier versions of web-browsers that do not support HTML5, such as IE6-9, are not compatible with the FGB.
The FGB can also be easily deployed on a user's server. The local install package of FGB is available at Here. A few basic supporting data is required for the FGB local installation, such as reference sequence, cytoBand, dbSNP database, HGNC Genes, refSeq genes annotation, and Linkage disquilibriums data. These data can be downloaded at Here. Tomcat6+ and JAVA is also needed for FGB running. Detailed instructions can be found in the package.
CONTENTS
Basic operations
Data input
Interpetation of output results
Analysis modes
Legends
Authors
References
BASIC OPERATIONS

1. Navigation • Navigation by chromosome coordinates chr1,Start:1234 End:5678 √
chr1,Start:1,234 End:5,678 x• Navigation by gene symbol Auto-complete √
Case-insensitive √2. Zooming ' ': Zoom in; '
': Zoom out
3. Browsing region adjustment ' ' and '
': region movement by the current span
' ' and '
': region movement by half of the current span
4. Navigating to interested browsing region by clicking and dragging the cursor on chromosome axis 5. Using whole genome bird's eye view to select a region
DATA INPUT
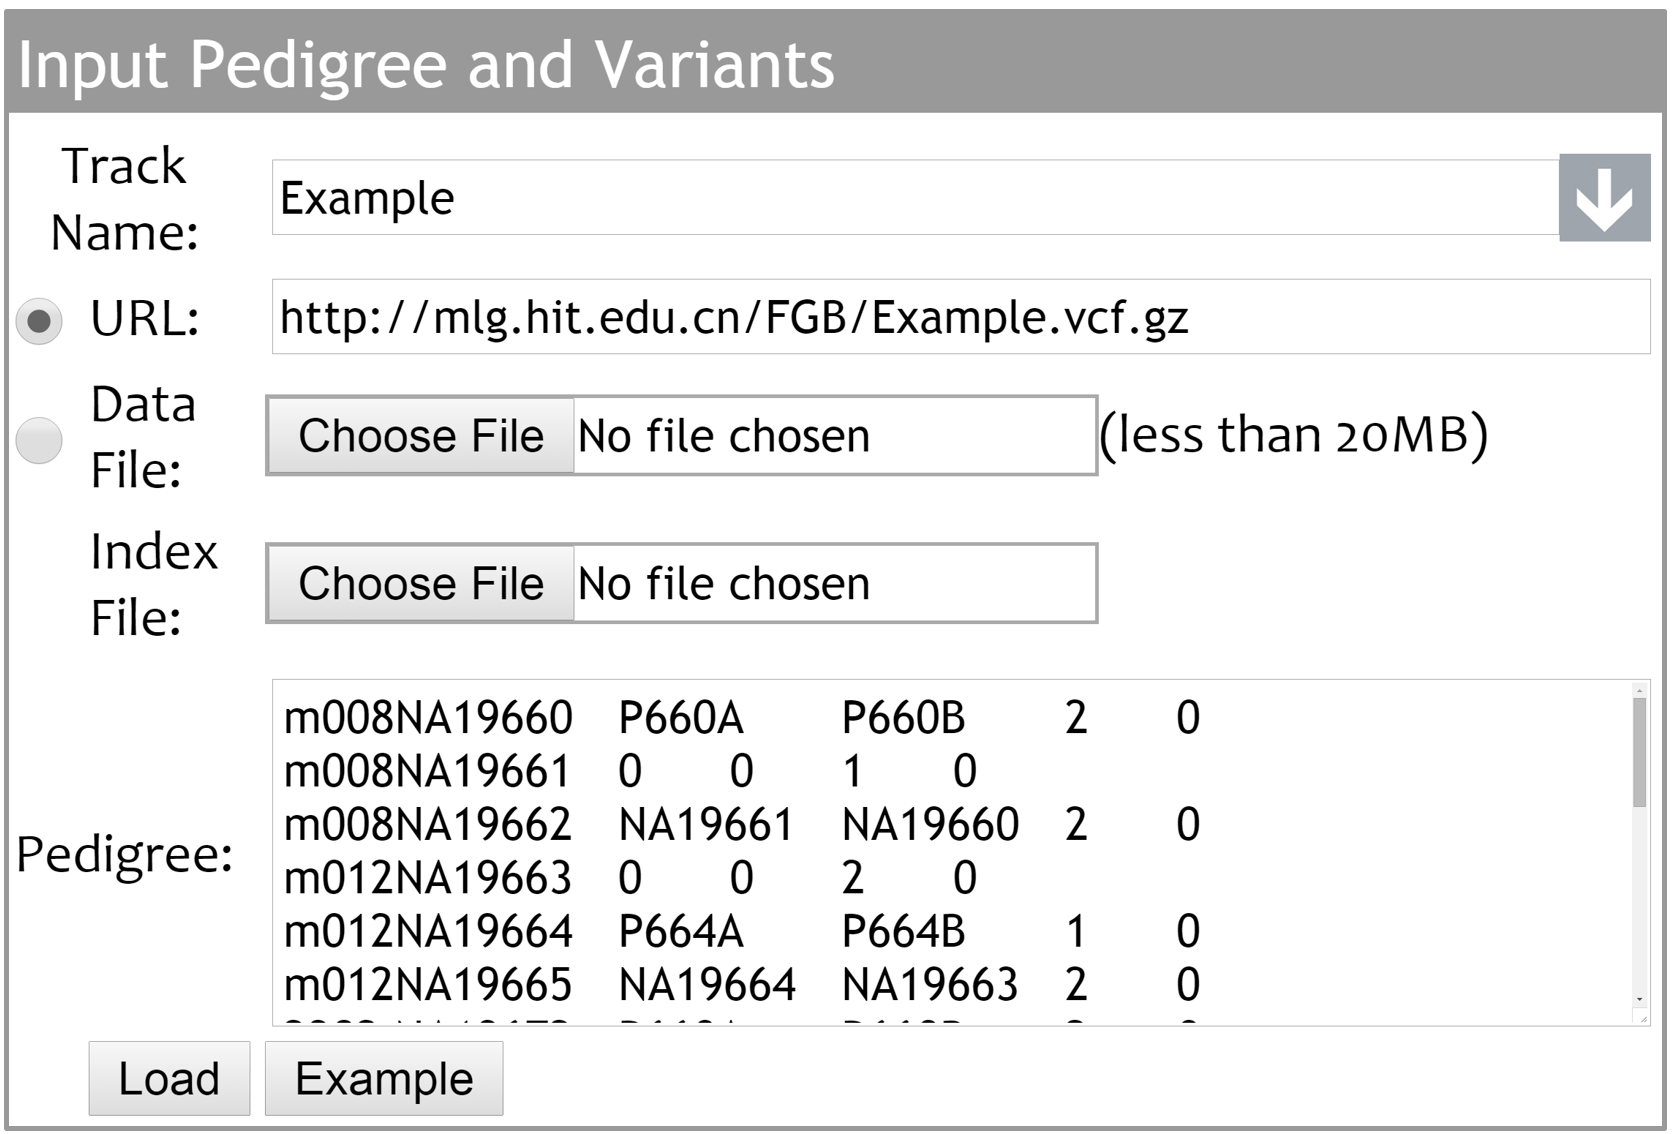
The FGB supports the Bgzip/Tabix compressed/indexed VCF files. Investigators can either provide accessible data URLs or upload local data and index files. By inputting family description in PED format into the ‘Pedigree’ text area, the pedigree chart of the family can be generated and displayed in ‘Pedigree’ tab.
The drop-down menu can be used to select and display the built-in and uploaded family genome data sets. The uploaded data can be removed by clicking ‘x’ button.
We currently hold 100 selected individuals from 1000 genomes project phase 3 dataset. Each of the 100 selected individuals has at least one relative in the dataset. The pedigree charts of six trios are displayed in the ‘Pedigree’ tab by default.
INTERPRETATION OF OUTPUT RESULTS
• Pedigree visualization
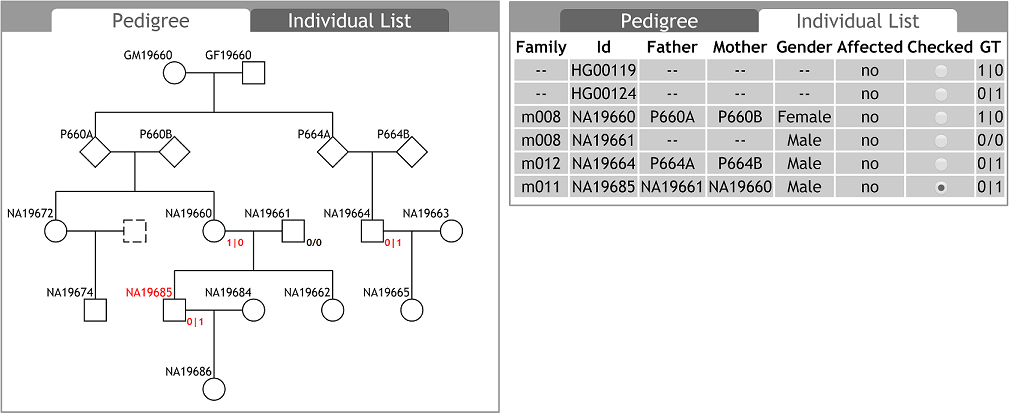
The pedigree information can be updated at any time, with the pedigree chart automatically updated. The individuals in PED text can be not necessarily identical to the samples in VCF data. Users can input and view a more complete pedigree chart than merely the family members whose genomic variants data is available. Selecting a data-available individual in the pedigree chart, genomic variants of the individual can be displayed in the ‘Browser View’ tab.
In some cases, individuals whose data is available may not be in the pedigree. For example, HG00119 and HG00124 are second-order relatives (grandparents, cousins, etc.) as annotated in 1000 genomes project datasets, but the pedigree chart cannot be plotted based on this knowledge. Users can find and select these individuals in the ‘Individual List’ tab. All samples available in the input VCF file are listed in the ‘Individual List’ tab. If an individual is in the pedigree, his/her basic information described in the input PED text, such as family ID, individual ID, father ID, mother ID, gender, phenotype, etc., are also listed.
• Family genome visualization
Family genome visualization are displayed in three scales: bird's eye view, browser view, and variant list view.
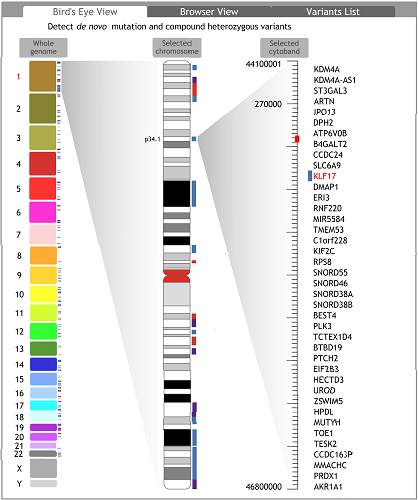
♦ Bird's eye view
Bird’s Eye View is a three-column genome view. All chromosomes are displayed as rectangle buttons in the left. The heights of rectangles are proportionate to the lengths of the corresponding chromosomes. When a chromosome is selected, the cytobands of the chromosome are displayed in a chromosome shape in the middle. When a cytoband is selected, the genes located in the selected cytoband are listed in the right area. Clicking on genes, users can view the corresponding region in the ‘Browser View’ tab.
In the ‘Bird’s Eye View’ tab, the FGB can scan an individual genome to detect de novo mutations and compound heterozygous variants in coding regions of a selected individual. After scanning, potential high risk genes containing the two kinds of suspicious variants are highlighted with red, blue or purple marks. Red marks indicate the genes containing coding region de novo mutations. Blue marks indicate the genes containing compound heterozygous variants. Purple marks indicate the genes containing both of them. Similarly, red, blue or purple marks are labelled to the cytobands and chromosomes containing colour-marked genes. The variants data of the selected individual’s parents should be available in the input VCF files.♦ Browser view
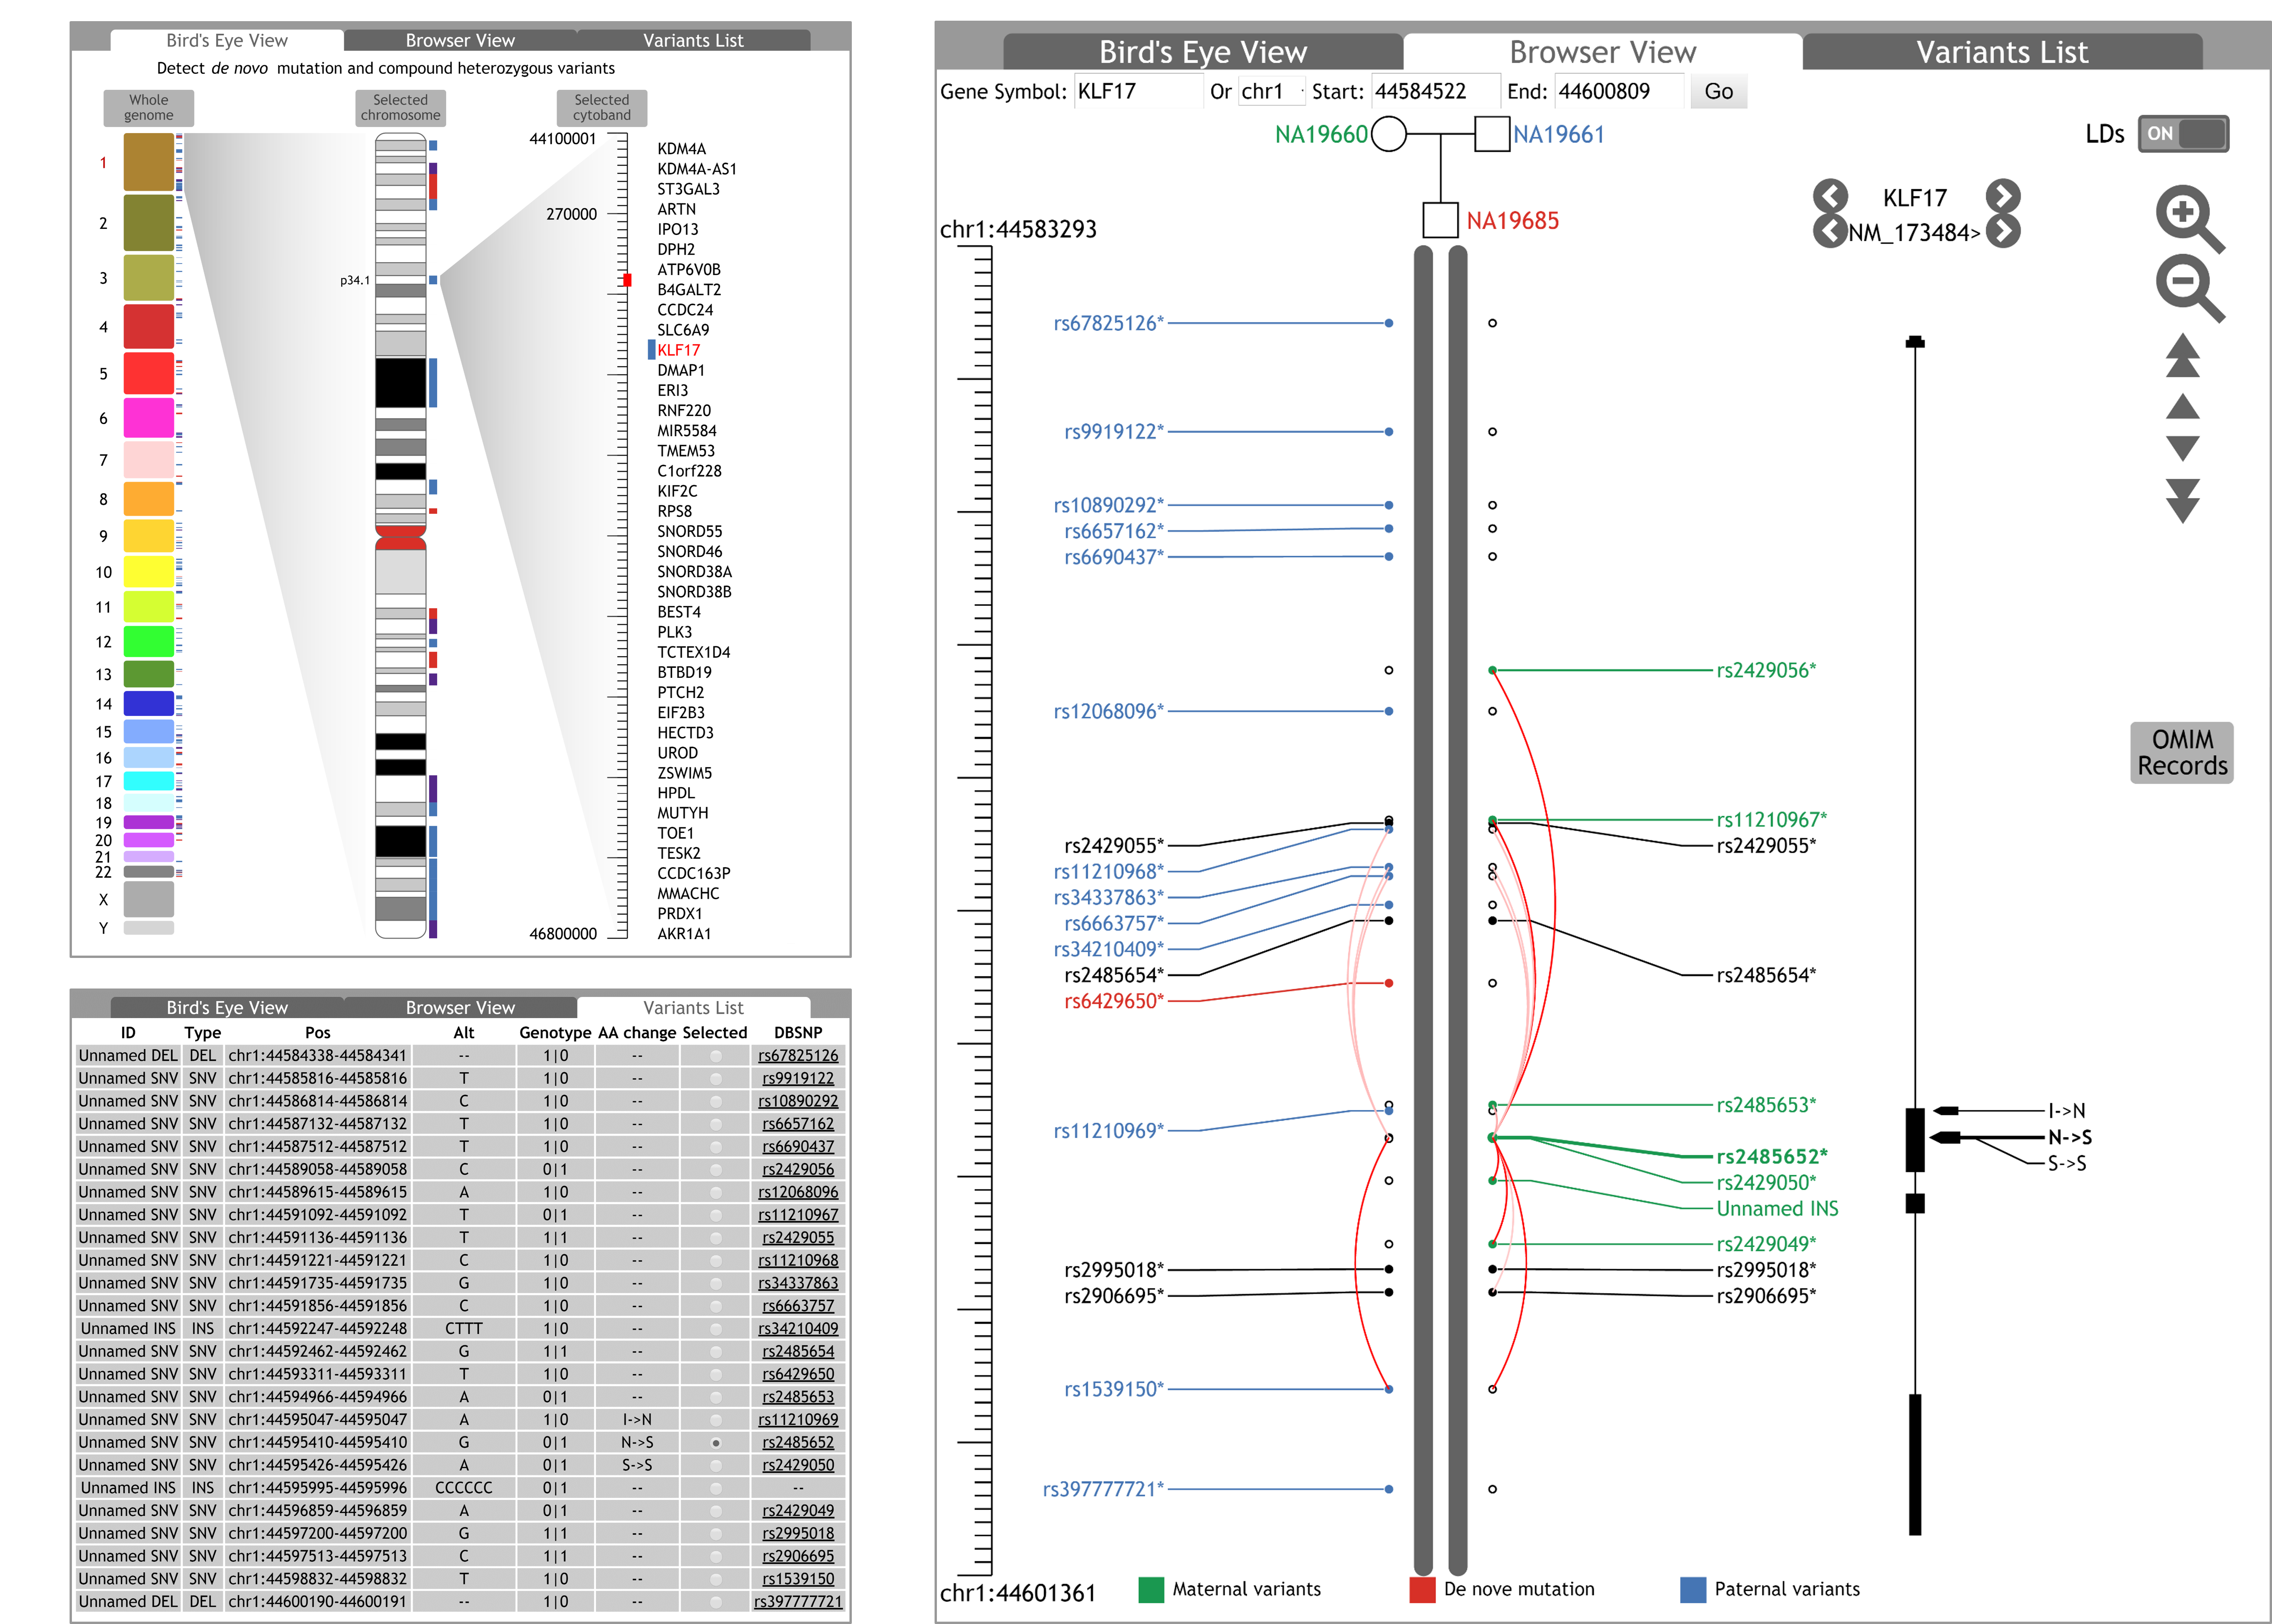
In the ‘Browser View’tab, the axis and the range of current browsing region are displayed in the left. Moving the cursor over the axis, a horizontal line and corresponding coordinate is shown to help users positioning the variants, the genes and coding region variations. By clicking and dragging the cursor on the axis, users can navigate to an interested browsing region.
Linkage disequilibrium (LD) describes the non-random association of alleles in population genetics.Colour gradients of the curves represent the R2 values of LDs between the variants. The curves are not displayed unless the R2 values are greater than 0.2. The LD curves can be optionally displayed or hidden by clicking the ‘LDs’ switch on the top-right corner of ‘Browser View’ tab. Transcripts of genes are displayed on the right of genetic variants. By switching the option buttons left and right, user can selectively view a single transcript, all transcripts of a gene, or all transcripts of all genes in the browsing region. Users can also investigate the detail of genes and transcripts in HGNC and RefSeq websites by clicking the names of the genes and the transcripts.
For phenotype analysis, OMIM records that are associated to genes in the browsing region can be queried and displayed by clicking the ‘OMIM record’ button, if applicable. Similar to dbSNP, HGNC and RefSeq annotations, the FGB provides links to corresponding OMIM webpage for details of OMIM entries.♦ Variant list view
Users may find more details of the displayed variants in the ‘Variant List’ tab. The detail information of the variants, such as ID, type, chromosomal position, alternates, genotypes, effects in protein coding region, corresponding dbSNP ID and link to dbSNP website, etc., are listed in a table. In the table, the variants are sorted by their chromosomal positions. Users can also select any variant in the table to view its genotypes in the whole family.
ANALYSIS MODES
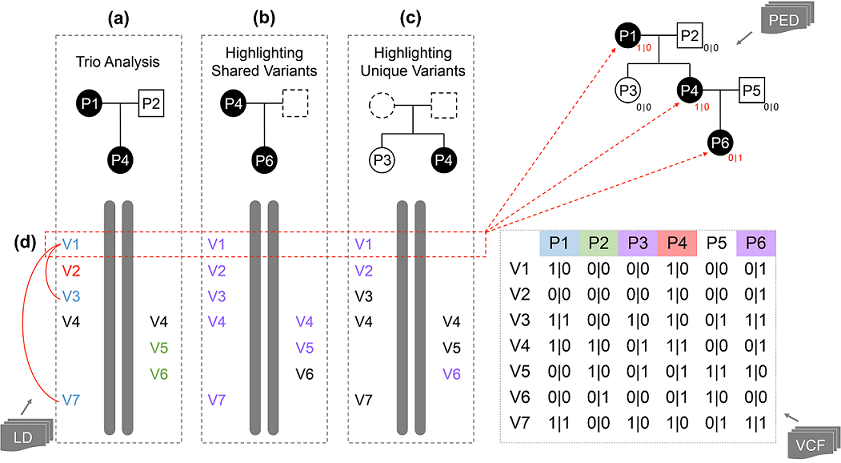
The FGB provides investigators three analysis mode: (1) trio analysis, (2) highlight shared variants, (3) highlight unique variants. Users can change the analysis mode on demand by clicking the individual symbol on top of the genome display in the ‘Browser View’ tab.
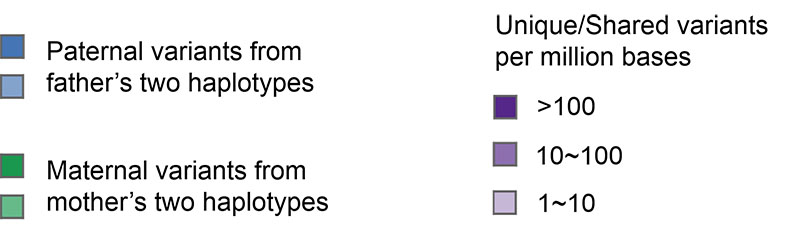
By default, for an individual whose parents’ data is available, the FGB identifies paternal variants, maternal variants and de novo mutations based on genotype information of the trio, and labels’ texts all distinguishable ones in different colours (Fig. a). The maternal variants are labelled in green; the paternal variants are labelled in blue; the de novo mutations are labelled in red. Other variants, including homozygous variants that inherited from both parents and variants whose parental origin cannot be determined, are displayed in black. For individuals whose parents’ data is not available, all variants are labelled in black.
Users may specify a group of individuals and investigate the shared variants among these individuals and the selected individual. The shared variants are labelled in purple. As shown in Figure b, this feature is developed to find disease causal variants that are shared among disease-affected family members.
Users may also specify a group of individuals and investigate the unique variants that only present on the selected individual. In this mode, the unique variants are also labelled in purple. As shown in Figure c, by comparing the selected individual which is affected by a phenotype, and the individual group that is not affected by the phenotype, this feature can help investigators to eliminate noncausal variants.
To further investigate the genotypes of a variant in the whole family, users can view the variant genotypes of all samples in the input VCF file by selecting a variant (Fig. d). The genotypes are displayed in the right-bottom corner of the symbols of family members in the pedigree chart, and in the eighth column of the individual list.
LEGENDS
AUTHORS
Liran Juan, Yongzhuang Liu, Yongtian Wang, Mingxiang Teng, Tianyi Zang, Yadong Wang*
Center for Bioinformatics, Harbin Institute of Technology, Harbin, Heilongjiang 150001, China.
Please do not hesitate to address comments/questions/suggestions regarding this webpage to: pgbrowser@gmail.com.
REFERECES
1. Axelrod, N., et al. (2009) The HuRef Browser: a web resource for individual human genomics, Nucleic Acids Res, 37, D1018-1024. 2. Choi, S., et al. (2014) FARVAT: a family-based rare variant association test, Bioinformatics. 3. Coordinators, N.R. (2013) Database resources of the National Center for Biotechnology Information, Nucleic Acids Res, 41, D8-D20. 4. Danecek, P., et al. (2011) The variant call format and VCFtools, Bioinformatics, 27, 2156-2158. 5. Fiume, M., et al. (2012) Savant Genome Browser 2: visualization and analysis for population-scale genomics, Nucleic Acids Res, 40, W615-621. 6. Flicek, P., et al. (2014) Ensembl 2014, Nucleic Acids Res, 42, D749-755. 7. Genomes Project, C., et al. (2012) An integrated map of genetic variation from 1,092 human genomes, Nature, 491, 56-65. 8. Gray, K.A., et al. (2013) Genenames.org: the HGNC resources in 2013, Nucleic Acids Res, 41, D545-552. 9. Hamosh, A., et al. (2005) Online Mendelian Inheritance in Man (OMIM), a knowledgebase of human genes and genetic disorders, Nucleic Acids Res, 33, D514-517. 10. Juan, L., et al. (2014) The personal genome browser: visualizing functions of genetic variants, Nucleic Acids Res, 42, W192-197. 11. Karolchik, D., et al. (2014) The UCSC Genome Browser database: 2014 update, Nucleic Acids Res, 42, D764-770. 12. Kent, W.J., et al. (2002) The human genome browser at UCSC, Genome Res, 12, 996-1006. 13. Koboldt, D.C., et al. (2014) Exome-based mapping and variant prioritization for inherited Mendelian disorders, Am J Hum Genet, 94, 373-384. 14. Kumagai, M., et al. (2013) TASUKE: a web-based visualization program for large-scale resequencing data, Bioinformatics. 15. Li, H. (2011) Tabix: fast retrieval of sequence features from generic TAB-delimited files, Bioinformatics, 27, 718-719. 16. Peng, G., et al. (2013) Rare variant detection using family-based sequencing analysis, Proc Natl Acad Sci U S A, 110, 3985-3990. 17. Purcell, S., et al. (2007) PLINK: a tool set for whole-genome association and population-based linkage analyses, Am J Hum Genet, 81, 559-575. 18. Robinson, J.T., et al. (2011) Integrative genomics viewer, Nat Biotechnol, 29, 24-26. 19. Schatz, M.C., et al. (2007) Hawkeye: an interactive visual analytics tool for genome assemblies, Genome Biol, 8, R34. 20. Sherry, S.T., et al. (2001) dbSNP: the NCBI database of genetic variation, Nucleic Acids Res, 29, 308-311. 21. Sincan, M., et al. (2012) VAR-MD: a tool to analyze whole exome-genome variants in small human pedigrees with mendelian inheritance, Hum Mutat, 33, 593-598. 22. Stein, L.D., et al. (2002) The generic genome browser: a building block for a model organism system database, Genome Res, 12, 1599-1610. 23. Thiele, H. and Nurnberg, P. (2005) HaploPainter: a tool for drawing pedigrees with complex haplotypes, Bioinformatics, 21, 1730-1732. 24. Voorrips, R.E., Bink, M.C. and van de Weg, W.E. (2012) Pedimap: software for the visualization of genetic and phenotypic data in pedigrees, The Journal of heredity, 103, 903-907. 25. Yao, J., et al. (2014) FamAnn: an automated variant annotation pipeline to facilitate target discovery for family-based sequencing studies, Bioinformatics. 26. Zhou, X., et al. (2011) The Human Epigenome Browser at Washington University, Nat Methods, 8, 989-990.
| fgb-1.0 | Family Genome Browser | 16 February 2015 |